- Signal Processing Tools
- The UTD Magnetic Observatory
- The One-Meter Pendulum
- Optical Flame Detection
- Redundant Systems
Signal Processing Tools
Almost every project that I have worked on as an industrial physicist has utilized the techniques of signal processing, which is the process of manipulating signals to perform a specific function or to extract useful information.
The methods used in signal processing were first developed in the 17th century with the invention of calculus by Newton and Leibniz. Physicists of the 18th and 19th century continued to develop various techniques for numerically processing data. In the 20th century, signal processing became firmly established in analog electronic circuits and later in digital implementations.
The first formal concepts of signal processing were introduced by Claude Shannon in his classic 1948 paper “A Mathematical Theory of Communication” which also showed the relationship of entropy to the information that can be extracted from a signal.
Signal processing takes many forms depending on the underlying phenomenology generating the signal and the desired information to extract. Signal processing can be performed in both analog and digital domains.
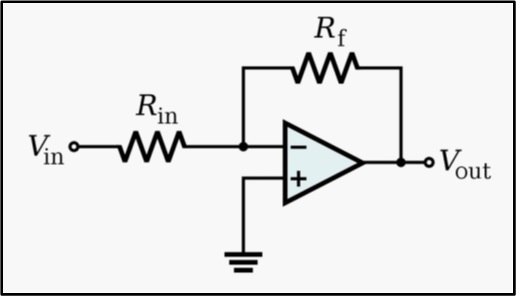
Analog systems operate with continuous time and signals. I’ve designed both linear and non-linear analog circuits for various signal processing applications.
Linear electronic circuits include amplifiers, additive mixers, passive filters, active filters, integrators, and differentiators. Usually, I have used these circuits as signal conditioners from a sensor prior to digital sampling or as part of an analog feedback loop.
Non-linear circuits include voltage-controlled amplifiers, voltage-controlled filters, voltage-controlled oscillators, and phase-locked loops. These applications all use some form of analog multiplication in their design and I have used these circuits for automatic gain and frequency control or for lock-in amplifiers.
Digital signal processing operates with discrete time-sampled signals. Procedures include fixed or floating point operations and real or complex operations. Processing may be done by a computer using numerical analysis techniques or by specialized digital circuits using microcontrollers, ASICs, FPGAs, and DSPs.
When using PC-based signal processing, I generally use LabVIEW, MATLAB, Python, or Excel/VBA for numerical analyses, although I have also used many other programming environments.

LabVIEW works well for dedicated data acquisition or instrumentation systems and allows integration of the user-interface for both control and analysis.

MATLAB has a wide range of applicability and has additional libraries and add‐ons, including the Signal Processing Toolbox which I use quite often.

Python is a general-purpose language that is open-source and free. I use the Anaconda distribution which is ideal for math, science, and engineering applications.

Quite often, I will stream data outputs from LabVIEW, MATLAB, or Python to Excel since many users are already familiar with the spreadsheet format and can incorporate the data for their application or for publication.
Excel can also be used for many analyses on smaller datasets. Along with VBA, the SOLVER add-in in tool has the capability to solve linear and nonlinear programming problems for signal analysis. It allows integer or binary restrictions to be placed on decision variables and can be used to solve problems with up to 200 decision variables. It’s surprisingly powerful.
The UTD Magnetic Observatory
I obtained my physics degrees from the University of Texas at Dallas (UTD) in the 1980s. During that time, there was an astronomical observatory on the north side of campus and a magnetic observatory on the south side. I performed instrumentation development and testing at the magnetic observatory.
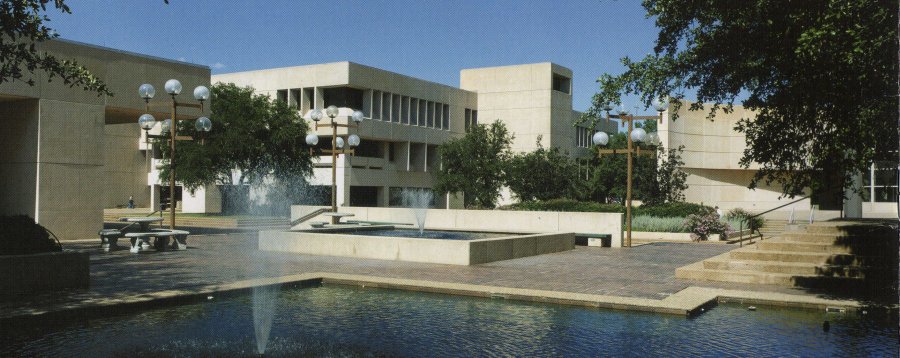
The astronomical observatory was built in 1979 and featured a 16-inch diameter Newtonian reflector telescope and a 5-inch guide telescope. The telescopes were housed in a two-story, 900-square-foot dome. The dome and telescopes could be rotated to view any area of the night sky. The observatory was used until 1986, when increasing sky brightness from growth in the North Texas area reduced the quality of the observations.
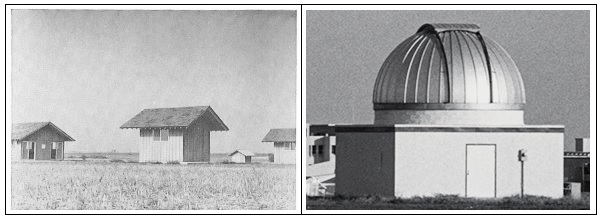
The original magnetic observatory and laboratory were completed in 1963 through the cooperation of the Graduate Research Center of the Southwest, the US Coast and Geodetic Survey, and Texas Instruments. The observatory was described in Physics Today in the December, 1963 issue.
The installation was located at latitude 32° 58′ 55″ North and longitude 96° 45′ 00″ West on land provided by the Graduate Research Center. The site was chosen after magnetic surveys revealed that man-made magnetic noise intensity was less than natural fluctuations and 60 Hertz magnetic fields generated by ground currents were less than 1 nT. Field inhomogeneities were less than 0.1 nT/foot. The buildings and surrounding land area were kept free of ferromagnetic materials.
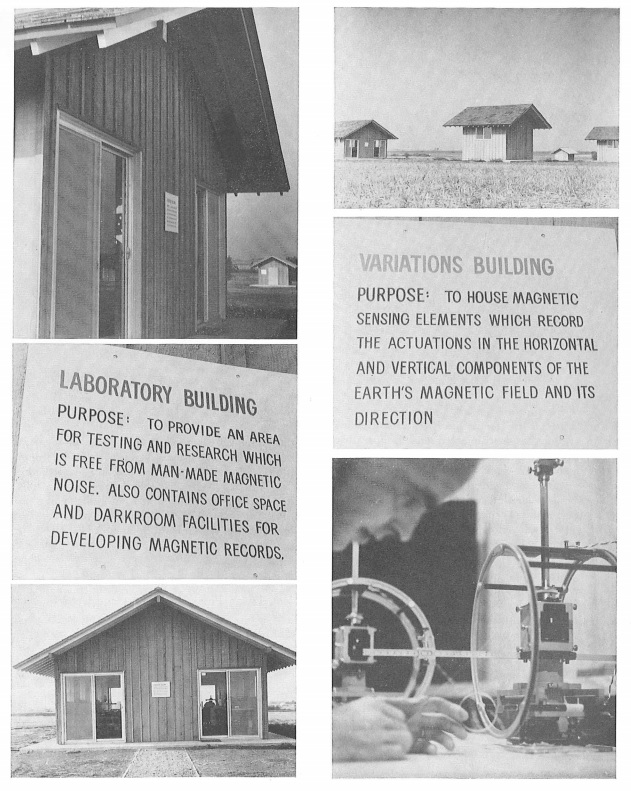
The observatory portion of the facility consisted of three small buildings designed and located according to the specifications of the Coast and Geodetic Survey. The first of these buildings housed the magnetometers used to measure changes in the components of the earth’s field. Two smaller buildings contained the equipment needed to furnish an absolute calibration reference for the magnetometer baselines.
The laboratory area, located 216 feet from the observatory buildings, consisted of a central structure 40 feet long by 20 feet wide and two smaller structures. Constructed of nonmagnetic materials, the laboratory was designed to provide space for experiments requiring a quiet magnetic environment. Office space and darkroom facilities were provided in the main building. All buildings on the site were constructed by Texas Instruments and donated to the Graduate Research Center. The observatory was equipped and staffed by the Coast and Geodetic Survey.
The events leading up to the construction of this facility established the birth of UTD. McDermott was a co-founder of Geophysical Service in 1930. Green and Jonsson worked with McDermott and they all purchased the company in 1941. Their first military product was a magnetometer introduced in 1942 for submarine detection, building on their seismic exploration technology developed for the oil industry This was a magnetometer system pioneering “MAD” or magnetic anomaly detection, still used today. The company became Texas Instruments in 1951 under Green, Jonsson, McDermott, and Haggerty.
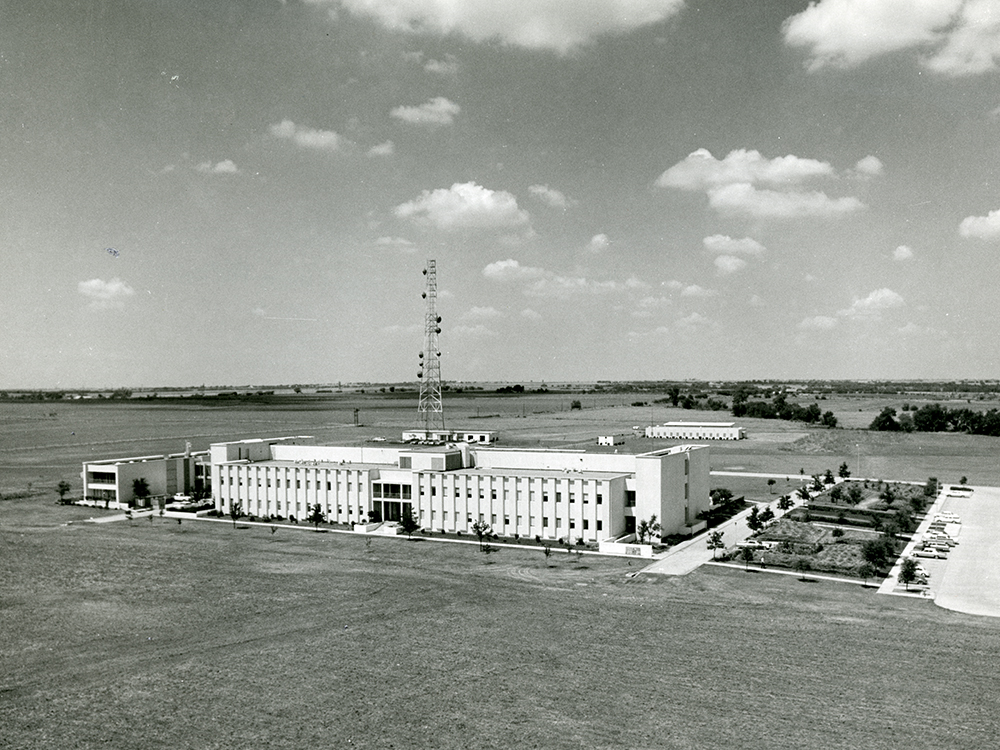
The UT Dallas founders, McDermott, Green and Jonsson established the Graduate Research Center of the Southwest in 1961. The institute initially was located in a room at the Fondren Science Library at SMU. Land for the center was acquired by Jonsson, McDermott, and Green in Richardson in 1962 and the Dallas Magnetic Observatory and the Laboratory of Earth and Planetary Science (Founders Building) were built. The facility was one of the first to research Schumann resonances and micropulsations. A lot of pioneering research in oil exploration, military magnetometers, and planetary science instruments was conducted in that building.
In the 2000s I worked with the talented team at Polatomic, Inc. which designed high sensitivity magnetometers and we used the magnetic facility for instrument testing. The founder, Dr. Robert Slocum, had previously developed helium magnetometers at Texas Instruments and started Polatomic with a group of Texas Instruments magnetometer engineers. Later, we refurbished the main building and built four new sensor buildings further south on campus land. Even with the continued city and campus growth surrounding the test site, I was able to measure Earth’s Schumann resonances and micropulsations with magnetometers that we developed. Eventually the campus expanded into the test site area and 50 years of magnetic measurements at the birthplace of UTD came to a close.
The One-Meter Pendulum
I’ve always been fascinated by oscillators and pendulums. I’ve designed and built all sorts of electronic oscillators ranging from audio to UHF frequencies. I’ve developed computer control systems for governing oscillatory motion in robotics and industrial automation systems. I’ve developed biomechanical analysis routines for human running using sinusoidal models for the oscillatory motions of the leg. I’ve developed physiological analysis methods for determining the transfer function between the oscillatory signals of arterial blood pressure and blood flow in the brain. My Ph.D. dissertation involved the measurement of atomic oscillator strengths observed in astrophysical plasmas. But it all started when I won a science-fair on the oscillation of a simple pendulum when I was in 8th grade.

For the science-fair project, I did the standard experiments of varying the length, mass, and initial amplitude of the pendulum and measured the period of oscillation for each condition. The display exhibit was made of PVC pipe and had a length of string that provided a period of around 2 seconds, thus crossing the lowest point at the bottom of the swing every 1 second. The length of string was 1 meter.
It can be seen that the period T=2π (L/g)^1/2 is independent of mass and amplitude and depends only on the length of the pendulum L and the acceleration due to gravity g. Interestingly, a 1-meter pendulum actually has a period of T=2.006 sec using the value for standard gravity g=9.80665 m/sec^2.
Why isn’t the period exactly 2 seconds? Could this be an effect due to the location of the pendulum? For a period of exactly T=2.000 sec, g=π^2=9.86960 m/sec^2, which is larger than the standard gravity value. The value for g does change for different locations on Earth and we can evaluate the variation using Newton’s law of gravitation.
Newton’s law of gravitation is F=GmM/r^2, where F is the gravitational force acting between two objects, m and M are the masses of the objects, r is the distance between the centers of the masses, and G is the gravitational constant. The gravitational force on an object (mass m) near Earth (mass M) is F=mg and the gravitation equation can then be solved as g=GM/r^2.
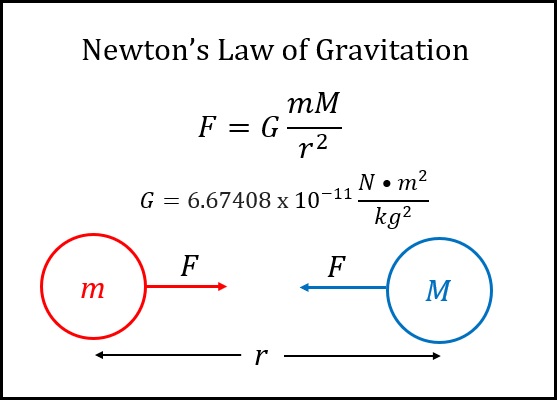
The gravitational constant is G=6.67408 x 10^-11 N*m^2/kg^2 and the mass of Earth is M=5.9722×10^24 kg. Since the Earth is not a perfect sphere, the radius varies from 6,357 km at the poles to 6,378 km at the equator with a global average value of 6,371 km and 0.3% variability (+/- 10 km). Thus, g will vary from 9.86328 m/sec^2 at the poles to 9.79844 m/sec^2 at the equator. The period of a 1-meter pendulum would then be 2.001 sec at the poles and 2.007 sec at the equator. For a period of exactly 2.000 sec, the value for the radius would need to be 6,355 km which is near the floor of the Arctic Ocean. Therefore, the defined length of the meter is not a result of the measurement location on Earth.
So why isn’t the length of a meter exactly defined by a pendulum with a period of 2 seconds, and correspondingly, why isn’t the acceleration due to gravity at sea level g=π^2 m/sec^2? Almost twenty years after my science fair project, these issues were discussed in an article “The Politics of the Meter Stick” by John Heilbron in the American Journal of Physics in 1989, and in a short note “The Meter’s Origins: A Clockwork Conspiracy?” by John Dooley in Physics Today in 1991.
The length of the meter was first standardized in 1791. Already at that time, the skilled instrument makers were building pendulum clocks with a standardized length which provided a 1-second tick which is a 2-second period. Reliable and precision clock escapements had been developed before 1791, so a standard length had been well established. It could be reproduced by any skilled instrument maker anywhere on Earth.
When the length of the meter was first officially standardized in 1791, politics took over. The French Republic appeared to start with a logical standard of length based on the 1-second pendulum, but then implemented a slightly different length based on the circumference of the Earth. This required expensive surveying expeditions. To exactly reproduce the French standard, one had to measure the circumference of the earth or make a trip to France to the location of the standard meter.
The current 1-meter standard (1983) is defined by the length of the path L travelled by light in a vacuum in t=1⁄299,792,458 of a second. This requires the established constant of the speed of light in vacuum (c=299,792,458 m/sec) and the definition of the second which is defined in terms of the caesium frequency. Thus L=c*t. In a practical implementation, the accuracy is limited only by the time measurement which can be precisely measured to one part in 10^13 using a caesium clock.
But the historical foundations of the length standard for the meter are founded in the simple pendulum. You can still establish the length of 1 meter with an accuracy better than 1 cm (accuracy limit L=0.9936 m) with a string, mass, and a cheap stopwatch near sea level (g=9.80665 m/sec^2) by setting the length such that 5 oscillation periods take 10 seconds.
Optical Flame Detection
I specialized in atomic and molecular physics in my Ph.D. program at the University of Texas at Dallas and developed a variety of spectroscopic instrumentation systems. Later, as an industrial physicist, I traveled to many power stations across the United States implementing optical flame detection systems which utilized my spectroscopy background.

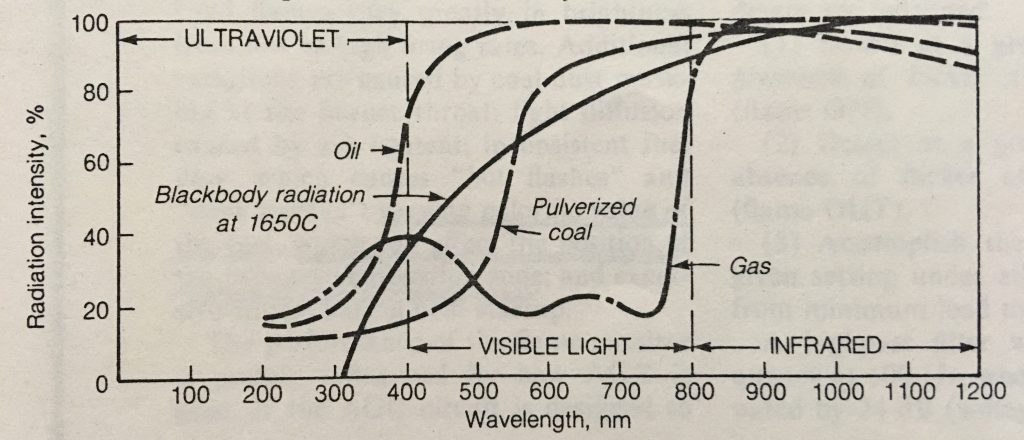
Optical flame detection embodies the sciences of physics and chemistry merging with the technologies of electrical engineering. All flames emit electromagnetic radiation. The figure shows the spectral distribution of radiation intensity for different flames (oil, coal, natural gas) with the background radiation emitted from a glowing combustion chamber.
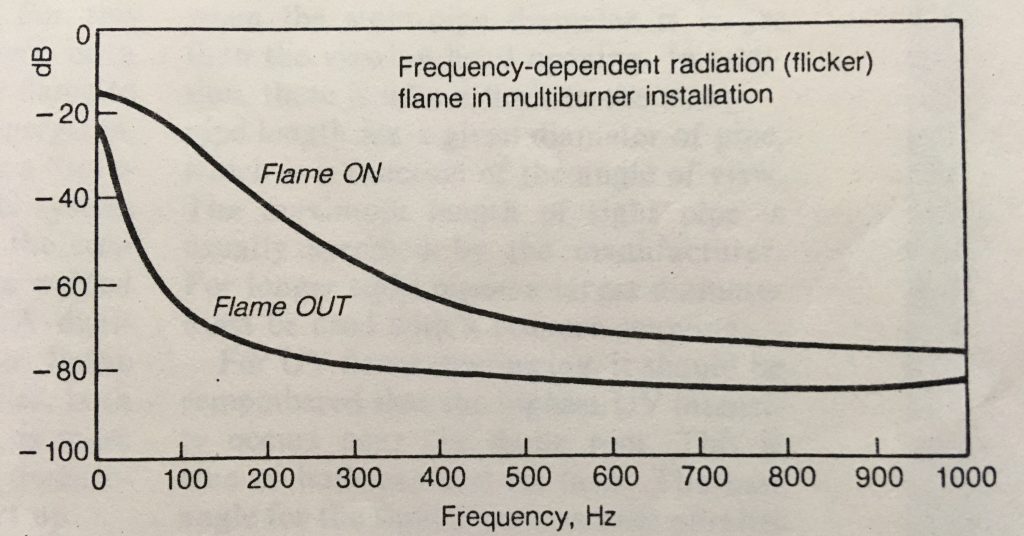
In addition to emitting steady light, all flames pulsate. Combustion takes place in the primary combustion zone in isolated domains, each containing burned and unburned fuel mixed with air in a highly turbulent way. The emitted radiation thus has an associated flicker frequency that is imparted on the sensor signal. The figure shows the flicker frequency dependent radiation derived from Fourier analysis for a coal or oil flame in a multiburner installation.
Flame detection thus utilizes the wavelength of the emitted radiation, along with the flicker frequency of the combustion process. Sensors and optical filters are chosen for the wavelength of interest. Ultraviolet sensors (UV-tubes, UV-Si) can be used for natural gas igniters and burners. Visible and infrared sensors (Si, PbS, Ge, InGaAs) can be used for oil and coal burners. Optical filters can further isolate the wavelength region of interest.
The radiation is detected through a sight tube, sometimes with appropriate lenses, installed in the combustion chamber. This can be a straight pipe or a high temperature fiber optic assembly. For wide angles of view, the combustion domains become less distinctive and spatial averaging takes place, resulting in a lower flicker frequency. Narrow angles of view have higher flicker frequency.
The flicker frequency bandpass filter in the signal processor is adjusted to provide discrimination between flame-off and flame-on conditions. The signal processor electronics also include fail-safe circuitry. Component or circuit failure anywhere in the system causes the flame status signal to turn off to produce a fail-safe response.
The implementation of these systems can be quite complex. For instance, I developed systems for megawatt boilers (700+ MW) with 48 coal/oil burners and their associated natural gas igniters. The burners were in a multilevel opposed wall-fired configuration. Thus, there were a total of 96 flame monitors which discriminated each flame from the background radiation and the other flames. If an individual flame status signal turned off, fuel flow to that burner or igniter was immediately valved off to control the combustion process, as well as prevent an explosion due to unburned fuel accumulations.
I also developed single flame detectors for gas turbine systems. The combustion chamber is relatively small and can approach the background blackbody radiation at 1650C. Thus, discrimination of the flame from the glowing chamber can be quite difficult. Since the blackbody radiation is negligible below 300 nm, an appropriate UV sensor can be employed with a cutoff wavelength below 300 nm. However, UV radiation can be absorbed by water vapor, carbon particles, and other combustion by-products. Therefore, flicker frequency signal processing can be implemented in these situations using visible and infrared solid-state sensors if the sensor is not saturated from the background radiation.

I implemented these flame detectors in hazardous areas and in environments that were hostile to electronics, optics, and sensors. False-alarm immunity, fail-safe operation, environmental tolerance, and maintenance practicality were all important factors in each design. High reliability, high sensitivity, and fast response times were critical.
Redundant Systems
I have used dual redundant systems to improve reliability for many applications, including flame detection, ordnance manufacturing, inspection automation, biomedical manufacturing, and spacecraft instrumentation design. The concept of dual redundant systems can be fundamentally described by considering two statistically independent events.
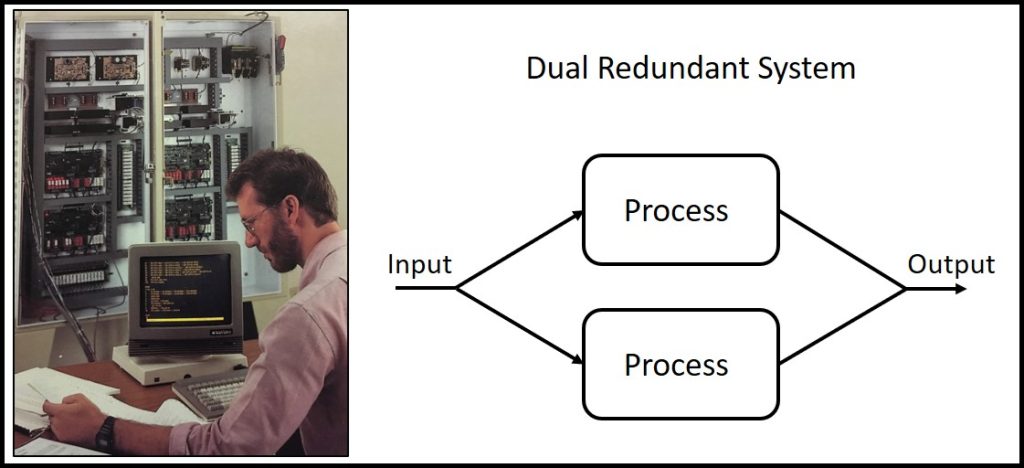
Two events are said to be independent of each other if the happening of one is in no way connected with the happening of the other. A coin is tossed from each hand. What is the probability of getting two heads? The appropriate theorem states that the probability of the joint occurrence of two independent events is the product of the separate probabilities of each of the events. The probability of getting two heads is therefore 1/2 x 1/2 = 1/4.
Consider a similar problem. A coin is tossed from each hand. What is the probability of getting at least one head? The problem may be solved by ascertaining the probability of the desired event not happening and subtracting this fraction from 1. Since the probability of getting two tails, which is the sole alternative to getting at least one head, is 1/4, the probability of at least one head is 1 – 1/4 = 3/4. Thus, the probability of getting one head is 1/2 (or 50%) with one toss, and 3/4 (or 75%) for getting at least one head with two tosses. As expected, two attempts dramatically increase the probability of success.
Now reframe this in a slightly different form using success and failure for a system process. Two identical systems are operating in parallel with a success rate of 9/10 (or 90%) for each process. What is the probability of getting at least one success? Since the probability of getting two failures, which is the sole alternative to getting at least one success, is 1/10 x 1/10 = 1/100, the probability of at least one success is 1 – 1/100 = 99/100 (or 99%). Thus, the probability of success is 90% with one system, and 99% for getting at least one success with two systems.
Another way to view this is in terms of reliability. There is a basic way to make a system more reliable. Redundant systems capable of independently performing the same process will increase the reliability of the total system.
A dual redundant system is a system that has two identical component systems that work in parallel. If one component fails, the other component can take over and continue to operate the system. This type of redundancy is often used in critical systems where a failure could have serious consequences, such as in power plants, medical devices, and spacecraft systems,
One way to implement a dual redundant system is to use a failover configuration. In a failover configuration, one component is the primary and the other component is the secondary. The secondary component is constantly monitoring the primary component for failures. If the primary component fails, the secondary component will automatically take over.
Another way to implement a dual redundant system is to use a lockstep configuration. In a lockstep configuration, both components are running simultaneously and their outputs are compared. If the outputs of the two components differ, then a failure has occurred and the system will take corrective action, such as switching to a backup system.
Dual redundant systems can be very effective at improving the reliability of a system. However, they are more expensive and complex to implement. The decision of whether to include a dual redundant system in a design must consider the cost, complexity, and reliability requirements of the process.
The incredible space mission Voyager is one of the best examples of the power of designed-in redundancy. The mission consists of two fully independent spacecraft launched separately in 1977 within days of each other. Each spacecraft has multiple redundant features including redundant control systems, three dual-redundant computer systems, and independent scientific instrumentation packages with overlapping functions.
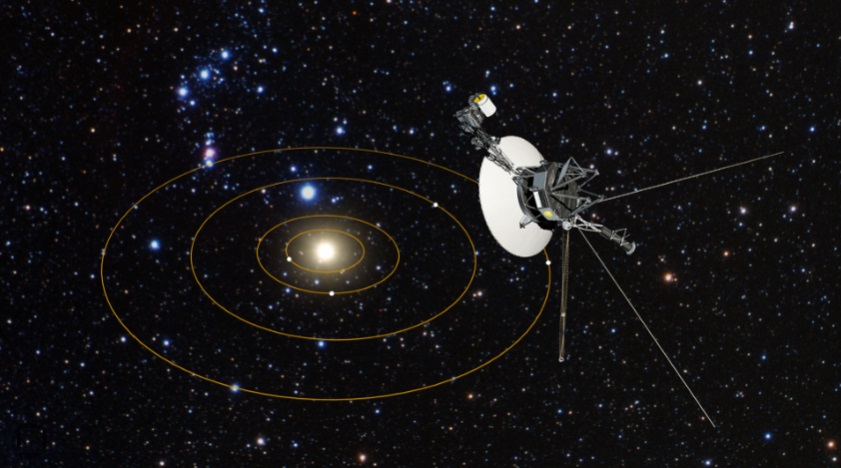
The spectroscopic data stream that I analyzed from Voyager 1 in the 1980’s was acquired during March-1979 in the Jupiter magnetosphere as it flew past Jupiter’s moon Io, 700 million km from Earth. Both Voyager 1 and Voyager 2 are now over 20 billion km from Earth. They have been operational and functional for over 47 years and continue to communicate with NASA’s Deep Space Network.